Resources
Women in science / STEM
I feel influenced by the lack of female role models in senior positions, both in academia and in industry. A better representation of women in important (academic) positions is important to to show that gender is not a barrier to career progression. I understand that people with other minority identities face similar challenges. I am passionate about contributing to equality, diversity, and inclusion in STEM. Ultimately, I hope to be able to inspire others and become a role model for fellow peers. Below, I highlight some resources I have found inspiring and/or helpful:

Fix the Leaky Pipeline (ETH Zürich program)
Fix the Leaky Pipeline is a programme at ETH Zurich giving young female scientists the opportunity to reflect on their professional situations, to develop a strategy for continuing their career paths, to receive targeted further training, and to extend their personal and scientific networks.
Did this really happen!?
Did this really happen? shares illustrative stories of events that actually happen(ed). It shows sexist comments and behaviours, not to point fingers at specific people, but to encourage discussions on incorrect behaviours. You can submit your own experiences anonymously to be featured.
500 Women Scientists is an organisation representing the voices of tens of thousands of women scientists all over the globe. During my time in Switzerland, I joined the Zürich 500WS pod (slack channel, twitter).
Communities
Venus Science networks
VExAG is NASA’s community-based forum designed to provide scientific input and technology development plans for planning and prioritizing the exploration of Venus over the next several decades. Open to all interested scientists, VExAG regularly evaluates Venus exploration goals, scientific objectives, investigations, and critical measurement requirements. I am currently serving a 3-year term on its Steering Committee and am leading a working group on Venus resources and data transparency.
The primary goal of this group is to support early career Venus researchers with networking opportunities, professional development through colloquiums and gatherings, and to foster community feeling. There is a OVEN mailing list and a slack channel that are very useful to join!
European Geoscience Union
EGU offers a platform for early career scientists (ECS) to become involved in research, outreach, skills development, and networking. One such way is to join the Early Career Scientist outreach team (blog/social media) or to become an Early Career Scientist Representative of a specific division.
The aim of the Planetary & Solar System Sciences (PS) Division is the promotion of all fields of planetary sciences, ground-based and space mission exploration of the solar system and beyond, and related models.
Studies related to the Geodynamics (GD) division include all aspects of dynamic processes in the lithosphere, mantle, and core. Check out GD’s blog website, social media channels, and the team to stay updated on any activities in the future!
Scientific visualisation
Visualization is, together with problem description, data production, and data post-processing, one of the main supporting pillars of science.
Scientific colour maps
Unfortunately, colour maps that visually distort data through uneven colour gradients and/or are unreadable to those with colour-vision deficiency remain prevalent in science (such as rainbow colour maps #endrainbow). It is extremely important to choose a scientific colour map that correctly visualizes your data and to use scientific figures that are intuitive and easy to interpret. I am a huge fan of the official scientific colourmaps by Dr. Fabio Crameri. The colour gradients in these colour maps are perceptually uniform and ordered to represent data both fairly and intuitively. Moreover, they are readable both by colour-vision-deficient and colour-blind people, and even when printed in black and white.
Science Graphics Collection (S-ink)
You can find numerous effective, high-quality science graphics in the Science Graphics Collection s-Ink.org. This collection consists of eye-catching, science-proof scientific-style artwork readily available to both the science community and the general public. You can also contribute to the collection by submitting your graphic and receiving the appropriate credits!
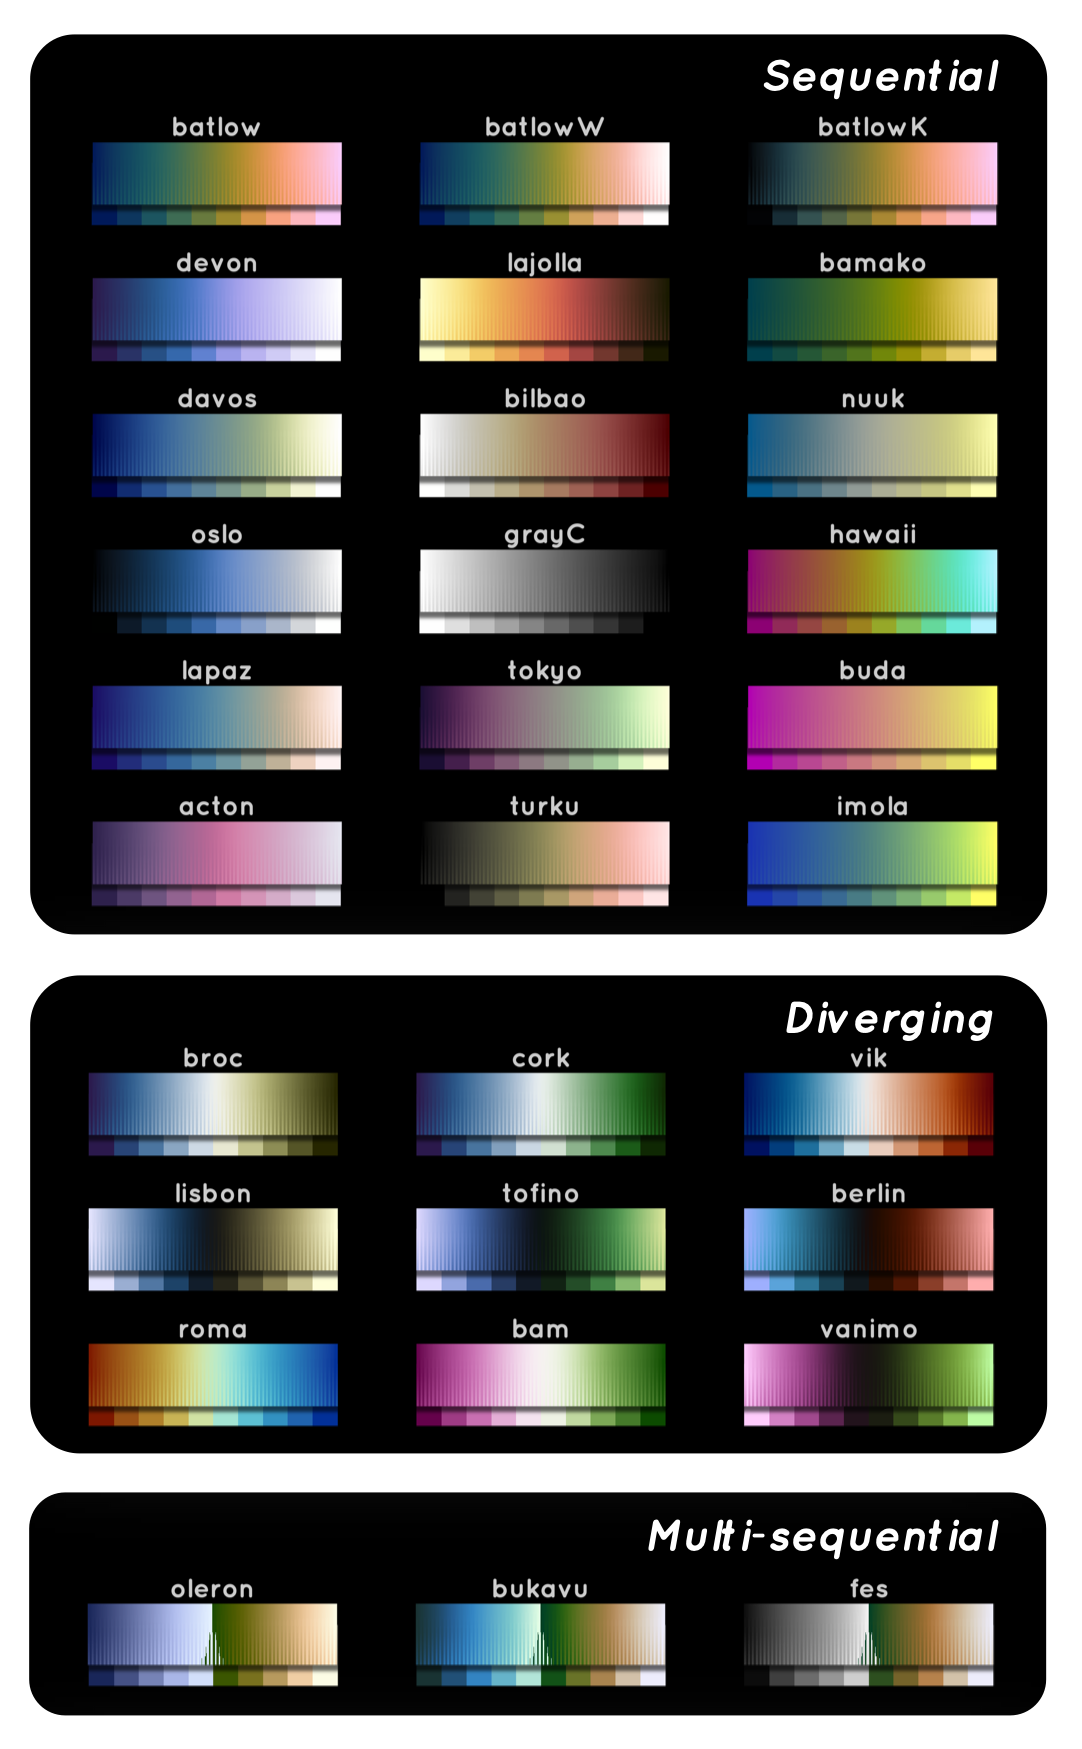
Selection of Scientific colour maps 7.0.1 (Crameri, 2018). I particularly make use of the BatlowW, Davos, Oslo, Lapaz, and Vik colour maps in my scientific visualizations.
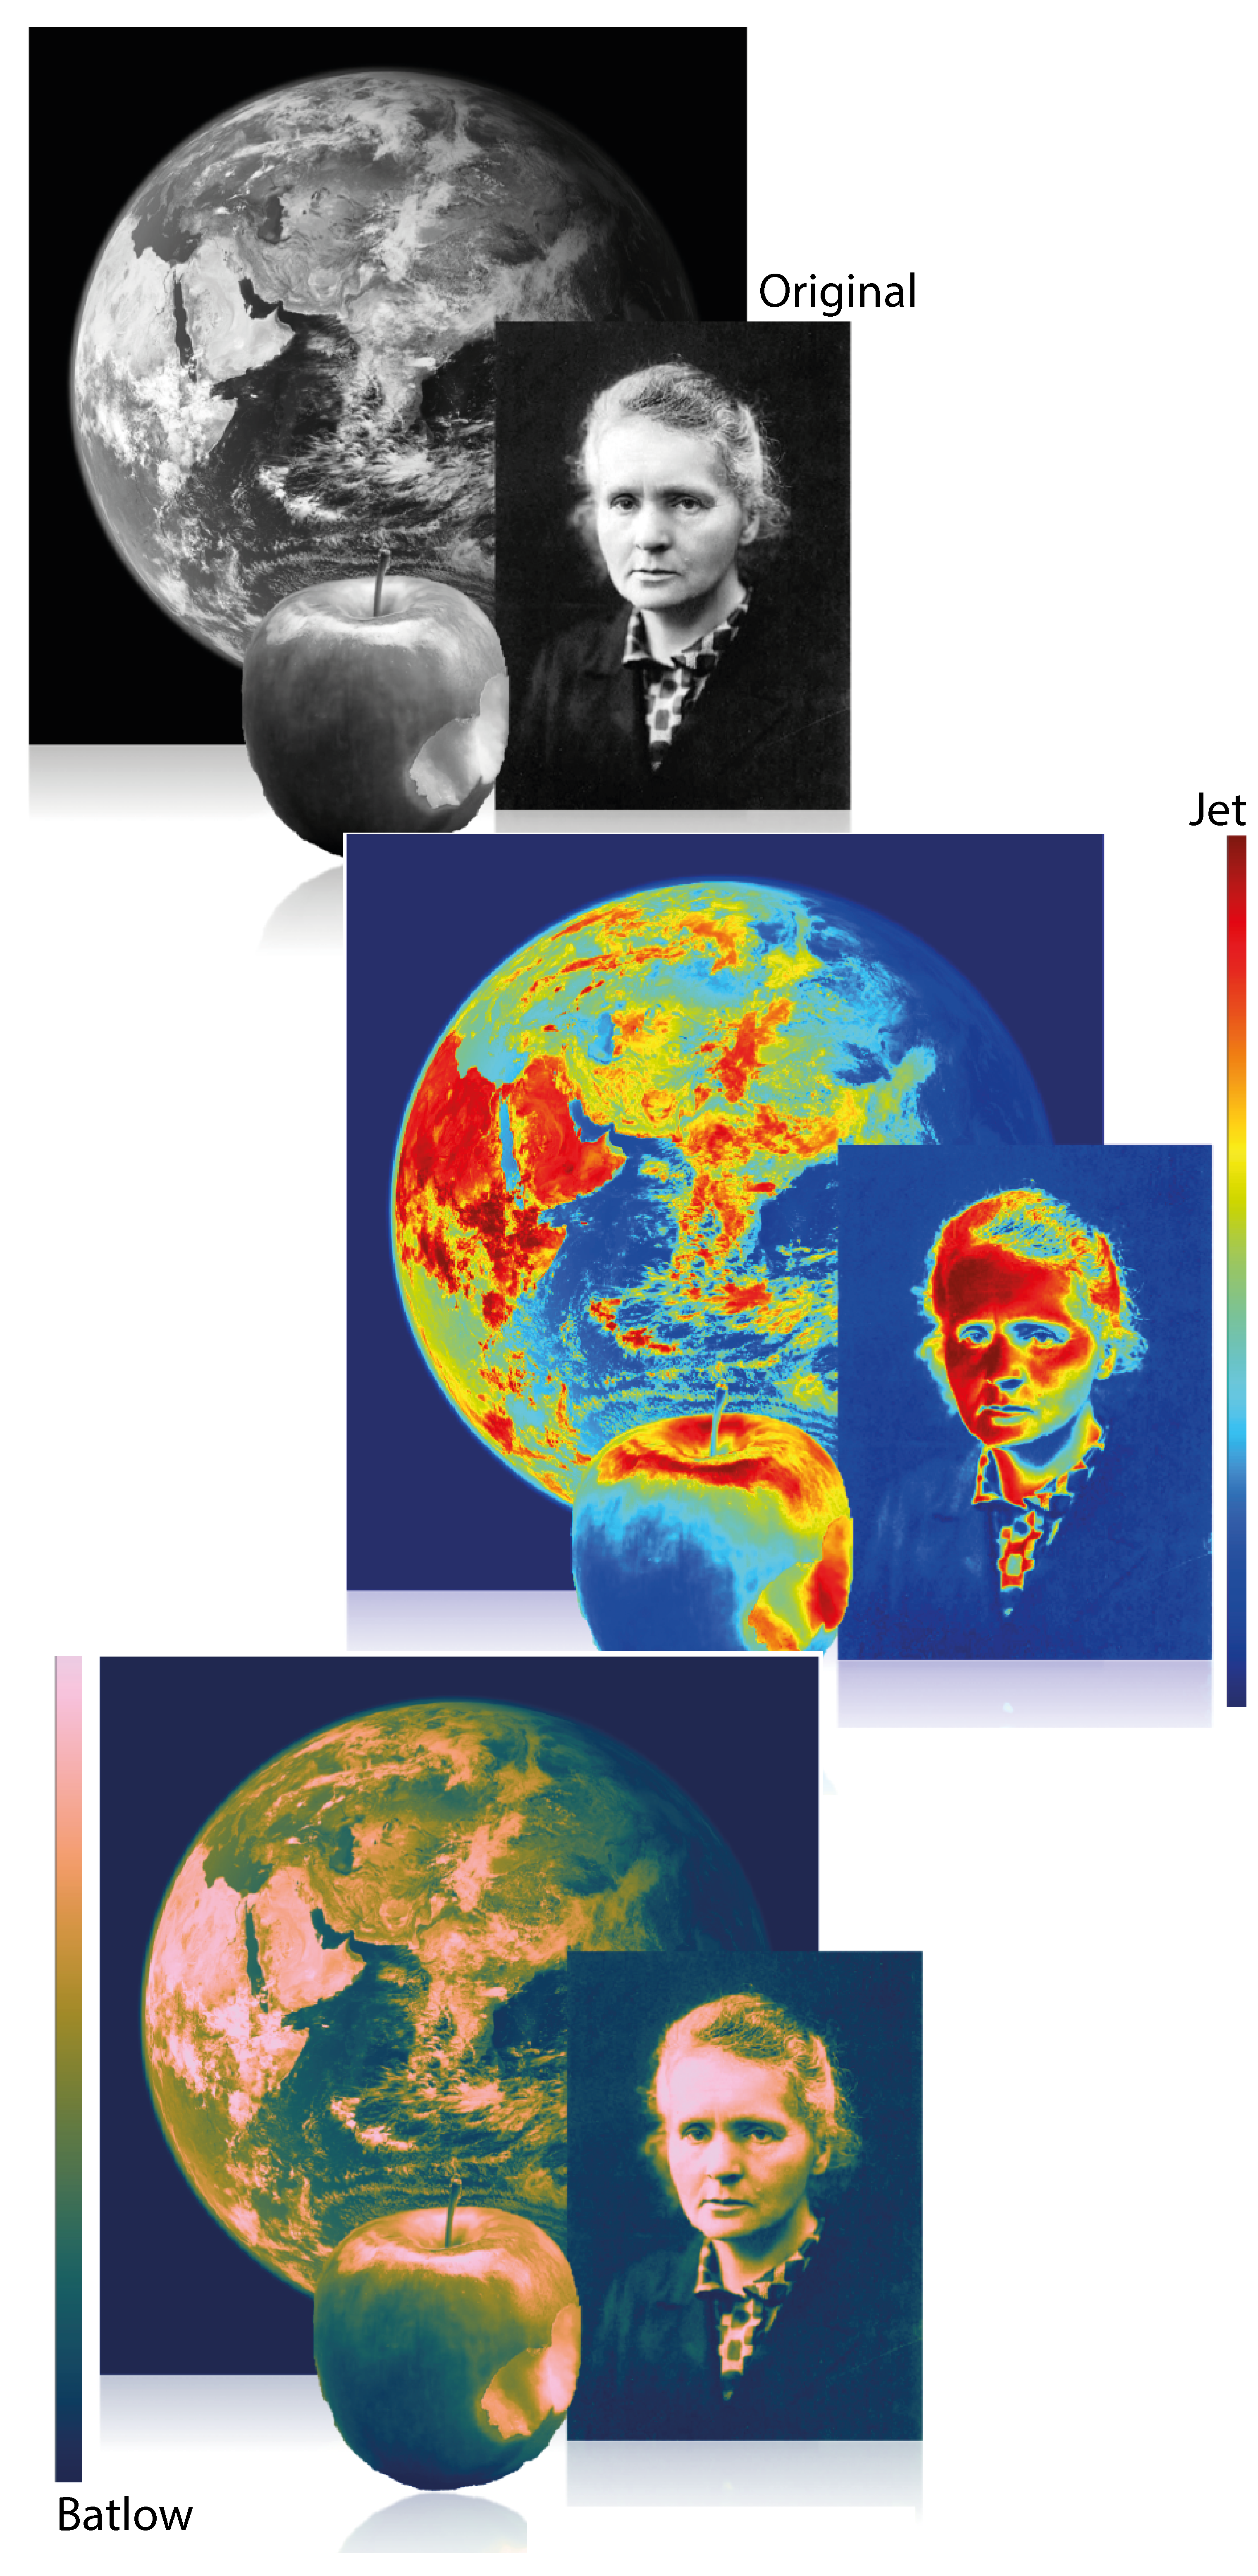
The superiority of scientifically derived colour maps. From: The misuse of colour in science communication (Crameri et al., 2020)
Software and tools
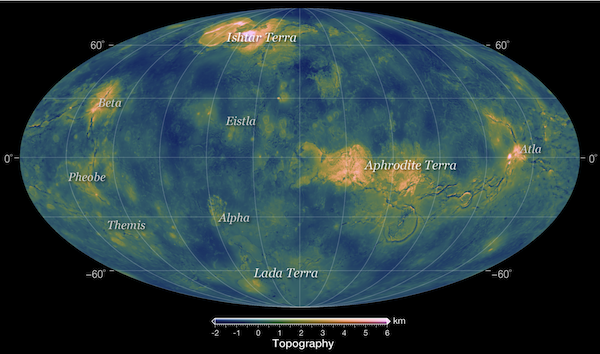
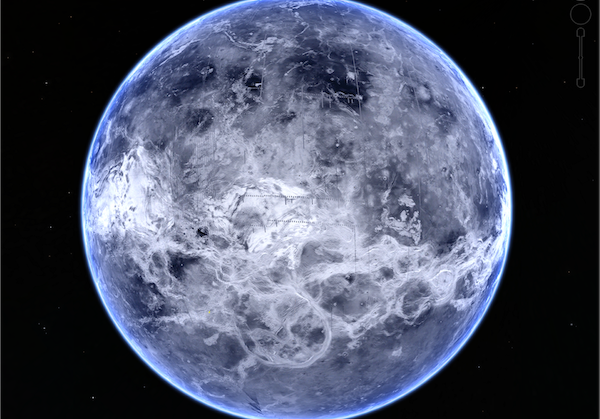
Top: Map of the topography of Venus made with GMT. Used in Gülcher et al. (2020, Nature Geoscience). Bottom: Google Venus FMAP map.
Venus Quickmap
Venus.quickmap.io is an online interactive mapping tool that allows users to explore the surface of Venus. It provides many types of datasets, including SAR imagery, topography, Magellan gravity, geophysical products, and many more. Users can also access detailed geological information, including volcanic features, impact craters, and other databases.
Generic Mapping Tools (GMT)
The Generic Mapping Tools (GMT) is a widely used tool to process geospatial and geophysical data, generate beautiful illustrations (especially maps), automate workflows, and make animations. It is free, open-source software! There is also a very convenient Python interface called pyGMT. It is definitely worth checking out if you are interested in creating maps from geospatial data!
Interactive mantle convection visualisation
Check out this easy tool to visualise thermal mantle convection in an interactive and intuitive way (Ian Rose‘s GITHUB page). This online tool is great for teaching and educative purposes – and just simply fun!
Google Venus
Much of our understanding of the geodynamics and geology of Venus has been derived from radar imagery and topography from the Magellan mission (NASA 1989-1994). These data were archived at the Planetary Data System (PDS) and are easily and freely available. In an effort to promote public interest in Venus, scientists have created content for Google Earth that displays several types of information from the Magellan-era: Google Venus (Sandwell et al., 2015).